July 19, 2026
·Jackson
Free Astrology Chart Widget for Your Website: Natal Chart, Bodygraph, Leads
Add a free interactive natal chart or Human Design widget to WordPress, Squarespace, Wix, Webflow, or Showit. Two lines of HTML, lead capture, pay per chart.
If you read charts for a living, your website has one job: turn a curious visitor into a conversation. Most practitioner sites fail at it quietly. A visitor lands, reads a paragraph about your approach, and leaves, because there was nothing there for them yet.
An embeddable astrology chart widget changes what your website is. Instead of describing what a reading feels like, your site casts one. A visitor enters their birth date, time, and place, and a full natal chart renders right on your page, computed at that moment against NASA JPL's DE440 ephemeris, the same planetary dataset used for deep-space mission planning. Not an image you uploaded. Not an approximation. Their sky, calculated.
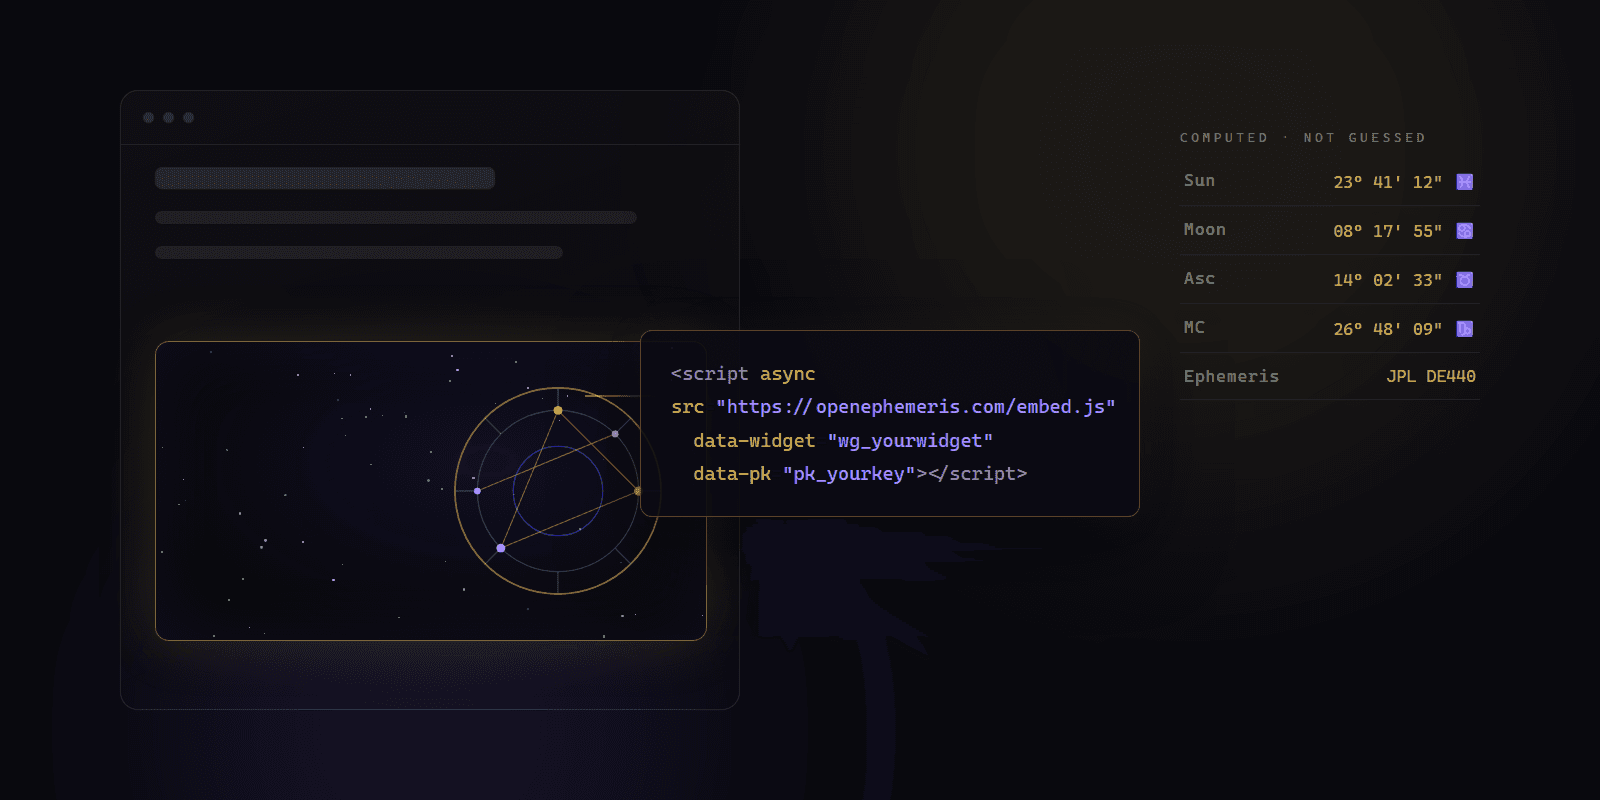
The install is two lines of HTML. Everything else (chart types, house system, zodiac, colors, your logo, lead capture) is configured in a dashboard and applies to your live site instantly, without touching the code again.
And as of September 2026 it is free. The natal chart wheel and the Human Design bodygraph widgets are included on every OpenEphemeris account, including the free tier, with lead capture. You pay per chart your visitors generate, from a $5 top-up, and never a subscription unless you want one. The synastry bi-wheel and a fully white-label widget are the two things that live on the Pro plan. Details below, plainly.
I made the widget free because of who kept asking for it. Not agencies, not app teams: solo astrologers and Human Design readers with a Squarespace site, a small list, and real clients, who wanted to give visitors an accurate chart on their own page instead of sending them somewhere else. A subscription was standing between those practitioners and the thing that would grow their practice. So now the chart wheel and bodygraph are free on every account, the lead capture is free, and you pay about ten cents per chart from a $5 top-up, never for a quiet month. The precision underneath is the same engine developers pay to call through the API. Your site casts real charts, your leads stay yours, and you get to decide when it's worth more.
— Jackson
Try the Astrology Chart Widget Right Here
This is the real widget, embedded in this post with the same iframe the two-line snippet produces. Put in a birth date, time, and place:
What Your Visitors Get
Three chart types, in one widget, as tabs:
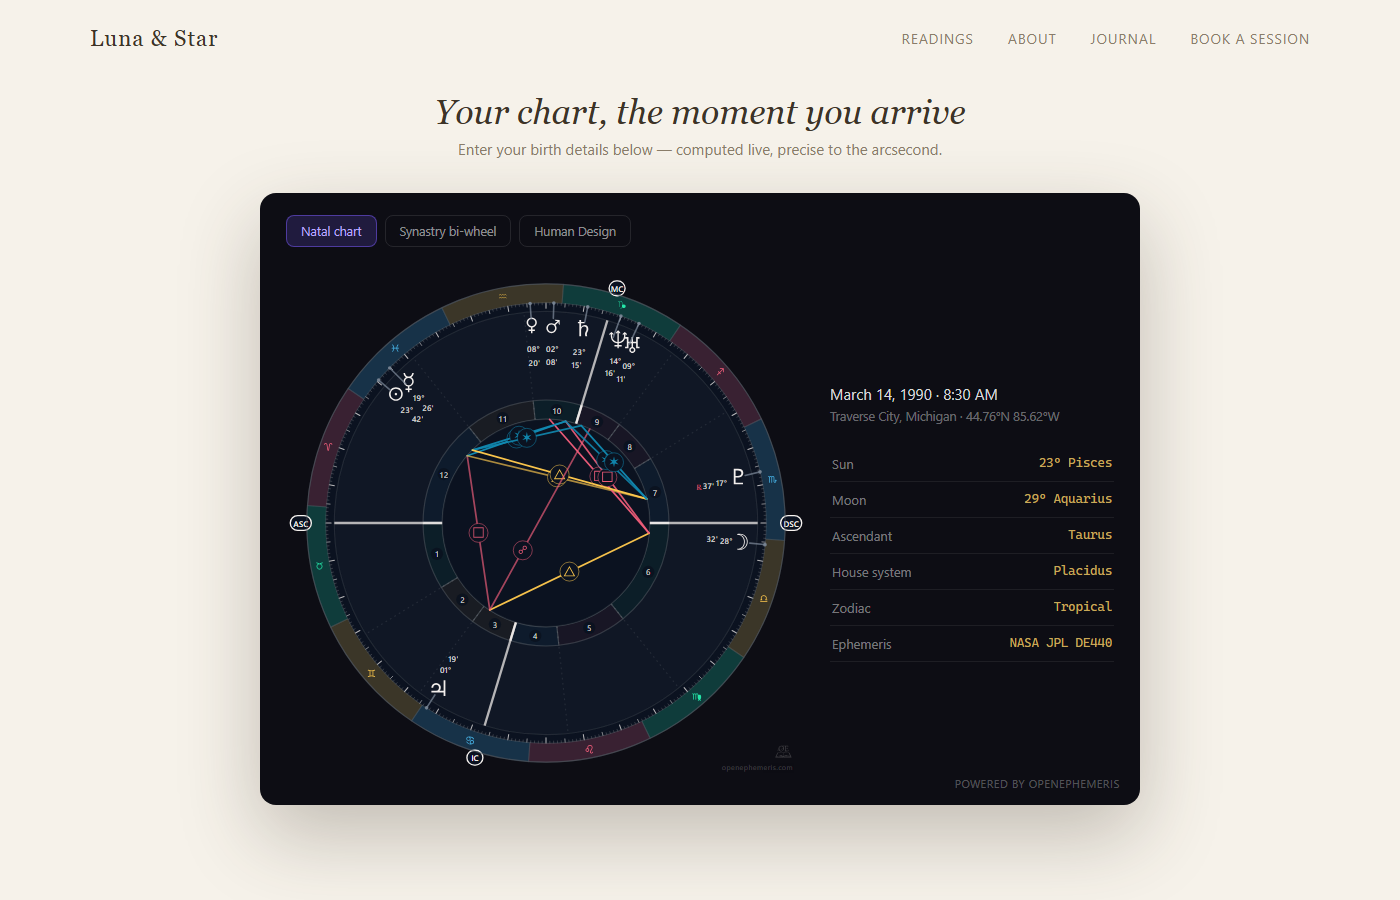
A natal chart wheel is the full wheel: planets, houses, aspects, angles, rendered as crisp vector graphics that match your site's theme. Optionally interactive: hover or tap a planet and an info card explains what it is (bodygraph too). Free on every account.
A Human Design bodygraph shows type, authority, centers, gates, and channels, calculated from the exact moment the Sun sat 88° of solar arc behind its natal position. Most free HD tools approximate that moment with a day count; the widget solves it directly. Two layouts (the classic graph, or the mandala with the zodiac ring around it), with optional planet columns and variable arrows. Free on every account.
A synastry bi-wheel overlays two people's charts, for relationship-focused practices. Pro plan.
Your visitor picks a location from a built-in place search (no third-party maps, no API keys for you to manage), taps Generate, and the chart appears in about two seconds. On phones it scales cleanly: no pinching, no sideways scrolling.
Your Doctrine, Locked In
If you work in Whole Sign houses, a widget that silently renders Placidus is worse than no widget at all.
So the chart settings belong to you. House system, tropical or sidereal zodiac (with your ayanamsa), which bodies appear (classical, classical plus Chiron, or the modern set): you set them once in the dashboard, and every chart the widget casts follows your system. You choose, per setting, whether visitors may adjust it. Lock everything, or let the astrology-curious explore house systems on their own. Your call, enforced server-side, which means a visitor cannot override your doctrine even if they open the browser's developer tools.
Styling works the same way. Light, dark, or mono theme, your accent color, your logo in the widget, your own intro headline and footer text, so it reads as part of your site, not a bolted-on iframe from somewhere else.
The Part That Pays For Itself: Email Lead Capture
Charts are the gift. Leads are the business.
Flip on lead capture and the widget adds one honest step: before the full chart unlocks, the visitor is asked for their email, with a consent checkbox that cannot be hidden or pre-ticked. No consent, no lead. You can customize the headline, the button, and the consent wording to sound like you.
Every consented lead arrives with the birth details already attached, which means your first reply to a prospect can already say something true about their chart. That is a different opening move than "thanks for subscribing."
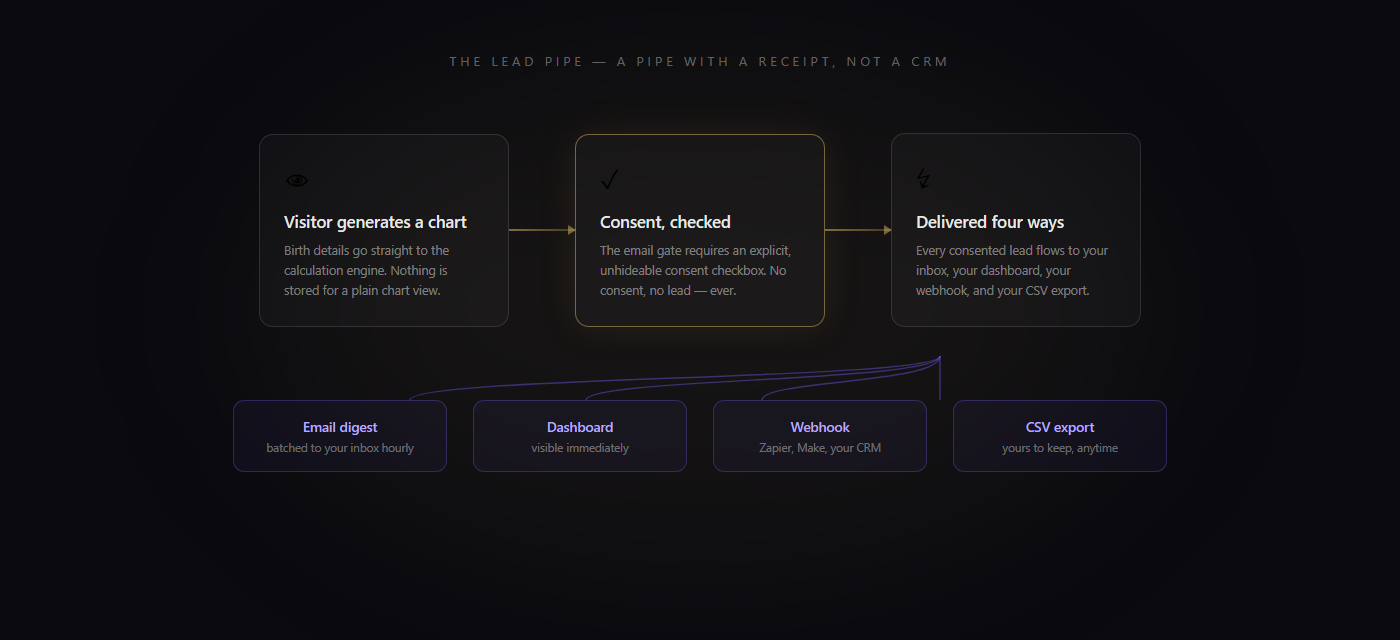
We built the pipeline as a pipe, not a CRM. Leads appear in your dashboard immediately, are emailed to you within the hour, and export to CSV whenever you want. On Pro they can also fire a webhook into Zapier, Make, or your own system, so a captured email lands in Mailchimp, Kit, Flodesk, or HubSpot without you copying anything. After 90 days we delete them from our side. They were always yours, and we don't keep what we don't need.
Lead capture is included on the free tier. Lead submissions are free; they never touch your credits.
Installing the Widget on Squarespace, WordPress, Wix, Webflow, or Showit
The snippet is two lines:
<script async src="https://openephemeris.com/embed.js"
        data-widget="wg_..." data-pk="pk_..." data-height="720"></script>
The dashboard generates it with your widget ID and publishable key already filled in. The script is async, so it can never block your page from loading, and it swaps itself for an iframe served from embed.openephemeris.com, so it cannot collide with your site's own scripts or theme CSS. Where it goes on each platform:
| Platform | Where to paste |
|---|---|
| WordPress | A Custom HTML block on the page (Gutenberg) or a Code element (Elementor) |
| Squarespace | A Code block. Requires the Business plan or higher, because Squarespace does not run scripts on Personal |
| Wix | Settings → Custom Code, body end. Not the "Embed HTML" block, which sandboxes the script on a Wix-owned domain and breaks the widget's domain check |
| Webflow | An Embed component |
| Showit | An Embed Code widget |
The install guide in the dashboard walks through the exact clicks for each, and an install checker confirms the widget is live on your page.
If you'd rather not touch your site at all, the dashboard has two escape hatches. One is a pre-written email you can send to whoever manages your website. The other is a copy-paste instruction block for an AI coding agent (Claude Code, Cursor, Codex) that contains your snippet, the placement rules for your platform, and a verification step. Paste it to your agent, and it installs and checks the widget for you.
And because the configuration lives on our side, the snippet never changes. Rebrand from dark to light, add a chart type, change your house system: your site updates the moment you hit save in the dashboard.
Your publishable key is locked to the domains you list. If someone copies your snippet onto another site, it simply does not load, and cannot spend your credits.
What It Costs, Plainly
Free tier. Every account, including the free Explorer tier, can create the natal wheel and bodygraph widgets, with lead capture. Free widgets carry OpenEphemeris branding: a small watermark on the chart and a "Powered by OpenEphemeris" link under the widget. That link is how the free tier pays for itself, and it is the only thing you give up.
Pro ($29/month) adds the synastry bi-wheel widget, Zapier/Make webhook delivery, and white-label: one toggle removes both the watermark and the link. It also comes with 75,000 credits a month, which is 25,000 charts.
Here is the whole billing model. Each chart a visitor generates costs 3 credits, billed to your account (one more than the same visualization costs from the API, because the widget is doing more than rendering). Loading the widget's configuration, the location autocomplete, and lead submissions are free, so a visitor typing "Melbourne" one letter at a time costs you nothing. If a render fails, the credits go back.
On the free tier, credits come from your wallet. A new account starts with 150 credits (50 charts), and you top up when you want to: $5 for 150 credits, $10 for 350, $20 for 900. Top-up credits never expire, and there is no subscription to cancel. As far as we know, no other chart widget is sold this way: you pay for the charts your visitors actually generate, and nothing while your site is quiet. On a subscription, widget renders and your direct API calls draw from one monthly allowance that resets on your billing anniversary.
If you do run out, the widget fails closed. Charts stop rendering and visitors see a "temporarily unavailable" card until you top up (which applies instantly, with no change on your site) or your allowance resets. What you will never get is a surprise invoice: overage billing is off on the widget, so there is no way for a busy month to quietly bill you past what you agreed to.
And you'll see it coming. Free accounts get an email when the wallet runs low and another when it hits zero, re-armed after every top-up; subscribers get one at 80%, 95%, and 100% of the allowance. Both show a banner in your dashboard. If you have a widget installed, the email says so directly, because in your case running out isn't an API inconvenience, it's your public site going quiet.
Your visitors never need an account, and their birth data for a plain chart view is processed transiently: computed, rendered, and gone. Data is only stored when a visitor explicitly consents to leave their details for you.
Two Lines, Then It Compounds
A practitioner's website usually works like a brochure: it describes, and then it waits. A chart widget makes it work like a first session. Visitors arrive curious, leave with their actual chart, and the serious ones leave you their email on the way, attached to the exact birth data you need to open the conversation well.
The widget above is the real one, running live. If it feels like something your visitors would stay for, create a free account and the dashboard will have yours configured in about five minutes. No card required.